Data Journalism — Analyzing Data's Use in Content
By Lynette Sawyer
August 20, 2019
Analytics, content, Content Intelligence, content management, content marketing, data, data journalism, Engagement, journalism, marketing, media, statistics
Data journalism. It isn’t as straight-forward as it sounds.
The term ‘data journalism’ has significantly evolved since it hit first the world of news media, then marketing, and now, the ever-popular domain of analytics. In today's modern world, data journalism is journalism.
The words ‘data’ and ‘journalism’ both carry weight in terms of breadth, expertise, and execution. When most people think of the word ‘data’, they think of numbers on spreadsheets, or thousands upon thousands of lines of code, insights from Google Analytics, or even Facebook. When one thinks of ‘journalism’, they may think of a time in our past with 1940s-era reporters named, something like Walter and Hildy, or Clark and Lois, furiously taking notes with their pencil and pad, their cameras popping with blinding flashes, crying out, “What a scoop!” More recently, there’s investigative reporting with the television programs likes of 20/20 and 60 minutes, or publications like Vanity Fair and the New Yorker.
What does data journalism look like? It is really no different from the journalism, or ‘content’ that we know and consume every day. Where traditional journalism relies on human sources, data journalism relies on, you guessed it, data sources. Although these sources may be different, one thing remains true—it is all about the stories! Everyone produces data—voluntarily or not—and we all create content. We’re actually journalists in our own right, be it articles for businesses, status updates, or Instagram stories.
A Brief History of Data Journalism
Nearly 200 years ago in New York City, there were two Cholera outbreaks. The first claimed the lives of 3,000 New Yorkers within weeks and then surged again in 1849 when more than 5,000 deaths were attributed to the epidemic. The New York Tribune used data and published a chart comparing weekly cholera deaths to total weekly deaths. This first instance of data journalism—specifically, a visual representation—helped readers to understand the outbreak’s progression course and peak. In the 20th century, a noticeable shift happened with publishers using data in journalism, plotting trends, and even making predictions.
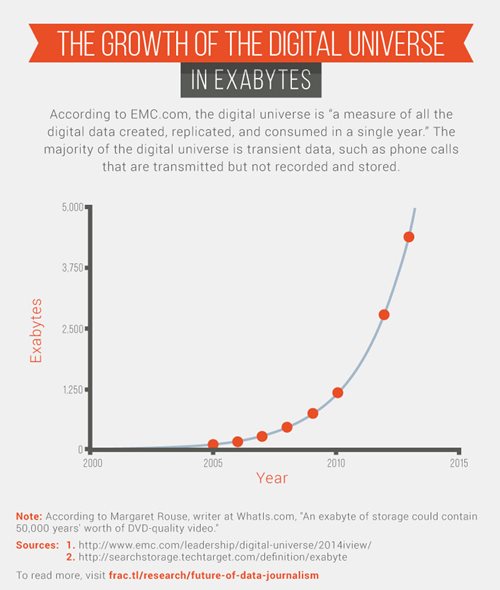
Fast-forward to today, and there is a never-ending list of opportunities for journalists and marketers to turn data into stories. In fact, since 2005, the size of the digital universe has grown by a factor of 33!
So, what does this all mean for your content development? Why should I use data? Once again, it is all about stories!
When scrolling through content today, most of it will typically reference multiple sources, quote from gurus or authorities, link to other blogs, and is filtered through a vast digital network. That content is further shared, or ranked, or commented on, and it is all collecting data! Thus, data journalism is vitally important. Gathering, filtering, and visualizing what is happening beyond what the eye can see has enormous value.
Data analysis can reveal “a story’s shape” (Sarah Cohen), or provides us with a “new camera” (David McCandless). Data journalism is an opportunity for us content makers and marketers. Using data in our content, we shift the focus from being the first to report to those who are fully telling the story and what it means. We can take large sets of data and turn numbers, or something abstract, into a very digestible, and easy to understand, piece of content. How? With a little analysis and a sprinkling of creative glitz and glamour. We have all seen animations or striking maps, and of course, we cannot forget those great infographics. These are all examples of data journalism.
Breaking down the Collecting of Data for your Journalism Efforts
A story can start with a slice of data, an important event, or simply a question. Maybe you are looking at trends in hospitality marketing, or tracing a measles outbreak in a community, or perhaps you’re simply tracking the usage of your mobile data. Once you have decided your direction, it is time to collect the data you need and dive into the full set or focus on one section. Review all of your data and compile the stats into one clean dataset of the information that you really need. Transform the data into an analysis or visualization-ready structure and ask yourself, what factors are you looking to expose from your dataset? This will help to finalize the dataset that is used to create your visualization.
Great Examples of Data Journalism
Data Journalism and Content Marketing
What do people and brands have in common? They love a good story! Enter data journalism. This approach is one of the best tools available for content marketers to tell engaging and unique stories that stand out from your competitors.
The data that your organization collects can be used to craft a narrative, develop a valuable story, or publish a piece on thought-leadership. When looking at your content strategy and marketing, leverage data journalism to talk about:
- User-centric research findings
- Unique characteristics or interests of customers
- Relevant growth trends
- Industry thought leadership
- Exploring a surprising outlier or anomaly
Interested in integrating data journalism into your content marketing? Here are the top five ‘dos’ and ‘don’ts’:
- Do establish trust
- Do have a clear angle
- Don’t Forget the Human Side
- Don’t Make It Complicated
- Don’t just publish and wait—promote, promote, promote
Is This Just a Trend?
Some of the most significant growth in data journalism is the collaboration on large scale projects. One such example is the Implant Files, by ICIJ, in partnership with 250 journalists in 36 countries, which investigated the harm caused by medical devices that have been tested inadequately or not at all.
So, is data journalism just a passing fancy? Yes, and no. It is a trend, but one that that won’t be going away anytime soon. Data journalism is growing in popularity and necessity for those of us in digital. Specifically, data skills will become a non-negotiable requirement for digital reporters. Data journalism is morphing what is simply journalism into data-driven stories that are becoming the norm, and data visualizations are appearing alongside these stories to bring seemingly unremarkable information to life.

Lynette Sawyer
Lynette Sawyer is a Web Project Manager for Falcon-Software, a digital web agency founded in 1994. For the last 13-years Lynette has been in various digital capacities and her expertise goes beyond Project Management. Lynette brings experience and knowledge in graphic design, marketing communications, project management, product management and engagement.