3 Email Marketing Performance Stats from the US
There is absolutely no denying that the portable ‘channel’ is quickly usurping the desktop computer as the go to device for engagement. It’s been this way for a while now. So, savvy marketers are paying very close attention to a report released by
Movable Ink recently which outlined just how systemic email interaction is with handheld smartphones and tablets.
Their report, which is based on collated date from their own email marketing platform, details findings between July 1, and September 30, 2013. Their metrics also cover multiple industries from retail, financial, travel, media and telecommunication.
Initial Trends
Skimming the surface, we are reminded again that mobile is dominating desktops with a whopping 61% of emails being opened on a smartphone or tablet device. That leaves, let’s see, 100 minus 61 (a couple 1’s borrowed), ahh, 39% left over for desktop emails.
Tablets continue their slow burn, chipping away at the crumbs that fall from the fading desktop email cookie. Since Q2, emails opened on a tablet rose to over 15%. Of that, iPad’s maintained their iron grip on tablet usage with a 10% jump sitting at 14.3%. While Android tablets saw a 27% gain (.9% of total) from where it was in Q2.
In line with the iPad numbers, iOS is still first on race day with 78.7% of all smartphone based engagement with Android at 20.7%, clearing 9.4% of ALL email opens in this period.
However, the numbers flipflop a tad when we look at who spends more time reading emails. The report found that 53% of Android users engaged emails for 15 seconds or more while only 41% of iPhone hung around to read the email.
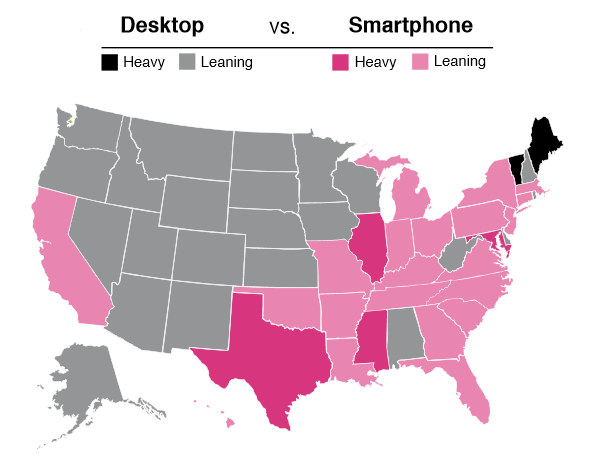
Last statistical tidbit was that the majority of the West and Central parts of the country still preferred desktop interaction while the South and East of the country were more inclined to read emails on their smartphones.
Email Opens
Mobile and portable devices are dominating. We will likely never see a reversal of this trend.
- 61% of emails were opened on a smartphone or tablet
- 45.52% of emails were opened on a Smartphone
- 39.19% of emails were opened on a Desktop
- 15.29% of emails were opened on a Tablet
- 50% of emails were opened on an Apple smartphone or tablet
- 10% of emails were opened on an Android smartphone or tablet
Further breakdown based on specific device
- 39.19% of emails were opened on a desktop
- 35.83% of emails were opened on an iPhone
- 14.29% of emails were opened on an iPad
- 9.42% of emails were opened on an Android phone
- .90% of emails were opened on an Android tablet
And the remaining crumbs were shared across Windows phone (.16%), Kindle Fire (.10%), other smartphone (.09%) and Blackberry (.02%).
Read Length
The amount of time that an individual spent reading these emails shows an interesting shift from the Apple dominated stats above.
The numbers below show that Android is the clear winner for actual engagement on both smartphone and tablet email users. The values below show that when a marketing email was read for longer than 15 seconds, which devices were used. (hopefully that makes sense).
- 50.55% were on an Android phone
- 43.91% were on an Android tablet
- 39.50% were on an iPhone
- 35.13% were on a desktop computer
- 30.01% were on an iPad
Email Opens by US State
This is quite an interesting chart with a clear geographical trend between desktop and smartphone use.
*source: Movable Ink US Consumer Device Preference Report: Q3 2013
- Heavy = More than 50% of recipients opened email on either device
- Leaning = Fewer than 50% of recipients opened email on either device
- The device that was used more frequently dictates the metric.
Clearly the most noticeable statistics here are that Apple dominates the physical device market and so will lean the ‘open’ data in its favour. However once they dig into actual engagement, Android suddenly jumps to the forefront with both smartphone’s and tablet’s rising above any Apple product for read length.
For the complete report please visit: https://movableink.com/downloads/us_consumer_device_preference_report_Q32013

Jade Carter
Jade is a content writer for CMS-Connected, facilitating the needs of the company blog. Bringing 10 years of Search and Digital Marketing to the table, he strives to build informative, relevant and fun editorial posts for the blog feed. Jade is an ultra distance (26.2 miles+) trail runner and lives to run trails in and around his home town of Victoria, BC.